The most interesting thing that I’ve learned about Language Learning Models(LLMs) this past week was that they don’t actually try to predict the right answer for the prompt, but that they purely go off of statistics with a little bit of context. I found the term ‘Stochastic Parrot‘ from Emily Bender’s lecture to be a good nickname for the process that LLMs use to answer any given prompt; similar to real parrots, they just repeat and string together words and/or sentences without knowing the meaning behind them.
3Blue1Brown. (n.d.). Transformers, the tech behind LLMs | Deep Learning Chapter 5 [Video]. YouTube. https://www.youtube.com/watch?v=wjZofJX0v4M
I found the video above from 3Blue1Brown to be a very understandable overview(for someone who hates computer science) of a bit of the background and process of transformers to LLM’s to the generative AI that we see now. And it really helps to illustrate not just how they work but also alludes to how they can go wrong and create negative feedback loops and hallucinations mentioned in the article by Jon Cheung, ‘How AI Image Generators Make Bias Worse.’ With how AI datasets are bound to have some form of bias in them, and then as generative creates more content representative of that bias, it then feeds back into itself, amplifying the biases even more.
Citations:
3Blue1Brown. (n.d.). Transformers, the tech behind LLMs | Deep Learning Chapter 5 [Video]. YouTube. https://www.youtube.com/watch?v=wjZofJX0v4M
Lis, & Lis. (n.d.). How AI image generators make bias Worse. London Interdisciplinary School. https://www.lis.ac.uk/stories/how-ai-image-generators-make-bias-worse
Harvey Mudd College. (2024, November 20). Emily Bender: “Don’t Try to Get Answers from a Stochastic Parrot” | 2024 Nelson Speaker Series [Video]. YouTube. https://www.youtube.com/watch?v=5m0ZolIb2hA
Declaration of AI Use: I acknowledge the use of Generative AI tools in writing this post: I used Grammarly to refine the language after drafting on my own, I declare that I reviewed and edited the contents as needed and take full responsibility for the content of my submission. All of the information I presented is complete and accurate.
I think some people feel like AI is this big black hole of countless data and there have been theories of AI taking over and someday attacking us/ ruling over us. Thats all very interesting but I think its best to learn about what to put into AI and what not to put into it as well as how to manipulate it.
I would say that I never thought about the fact that GenAI has a limited amount of resources to work with. I always thought it had an unbelievably vast amount of data to access.
I am learning a lot more about hallucinations which are “incorrect information generated from patterns that do not really exist”(The University of Texas System, 2025, p. 3). It has definitely happened many times before but I am now realizing that what I do in response to that, is asking the AI if it telling the truth and that if it truly does not know, it should let me know (it works!). For my academics, whenever I have to use AI, I try to run the same info through at least two AI’s and then take bits of information to a Google search.
I think the concept of closed and open LLM sort of addresses many privacy worries of using AI. A lot of people become unknowingly dependent on AI and end up putting their private information into chats. I think closed LLM could ease such worries in the sense that it is confined to certain people in an organization and as long as we minimize the access to our privacy, then it is possible to let go of such worries.
CITATION: The University of Texas System. (2025, November 11). UT aspire prompt literacy. The University of Texas System. https://utsystem.edu/documents/docs/general-documents/2025/ut-aspire-prompt-literacy
The thing I was most surprised by this week was the usability and existence of closed LLMs as opposed to the much more popular open LLMs. Most of the time people’s biggest concern with AI usage, or at least mine, is the ability to hallucinate, which is substantially less likely to happen if you can directly have control over the sources it tries to employ. By having a closed LLM to only use exactly the sources I provide makes certain types of work way more trustworthy. This doesn’t mean closed LLMs are the greatest resource of all time, if I have the sources I already know I need then it makes summarizing or studying them a lot faster and more trustworthy. However, open LLMs are still going to be extremely helpful when actually looking for sources or work that I don’t already have saved, so when looking for articles on JSTOR or other archives ChatGPT and Claude are still going to be my go-to’s. Outside of learning the basics of how an LLM works, the UT proper prompting guide was kind of interesting to me in how many ways they thought of giving prompts to get a specific answer they want but I didn’t necessarily find it helpful as my AI usage is already pretty accurate for what I use it for. The image generation on ChatGPT is also pretty good, much better than I was expecting it to be. Just look how trustworthy ChatGPT is the photo it generated for me when asked what he looks like in the real world.
Citations
University of Texas, 2025, UT Aspire Prompt Literacy ChatGPT prompt: give me a picture of chatgpt as a physical robot
A takeaway I have for the week is that I never knew what the GPT stood for, and it changes what I think of AI and how to use it in the future. Transformers can look at patterns in the words to predict what is next, so it’s not even checking if the info is true or not. It changes my perspective because some people trust AI to give them info for important things like school work, some journalism and more things that can’t afford the problems that come with the false info you could be getting from AI just because it sounds good.
One more thing would be the bias part from the How AI Image Generators Make Bias Worse article because it said that AI picture generators can repeat stereotypes from their training. For example, the small activity we did in class where me and my partner both typed in a prompt to give us a caretaker on two separate models and they both gave old white women with a white caretaker with the word caretaker on it. Or it can look like its connecting high paying jobs with lighter skinned people and men, but connecting lower paying jobs with darker skinned people and women. That changes my perspective not just for me personally but for companies and jobs in the future.
Overall, I just plan to keep using AI when i need it and only as a resource to check work and help stay organized because it’s not really as trustworthy as people think.
Sources:
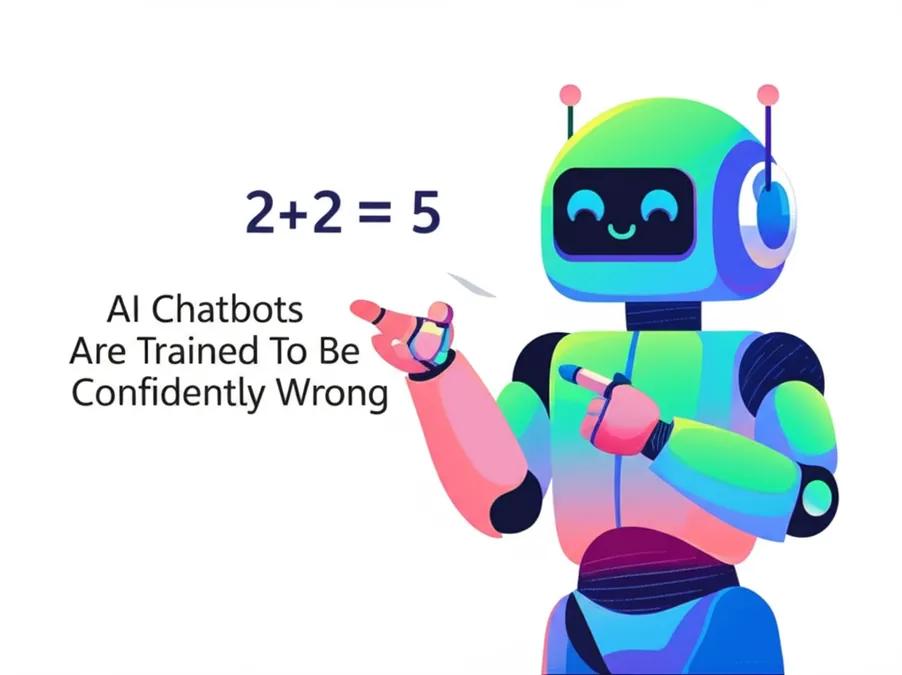
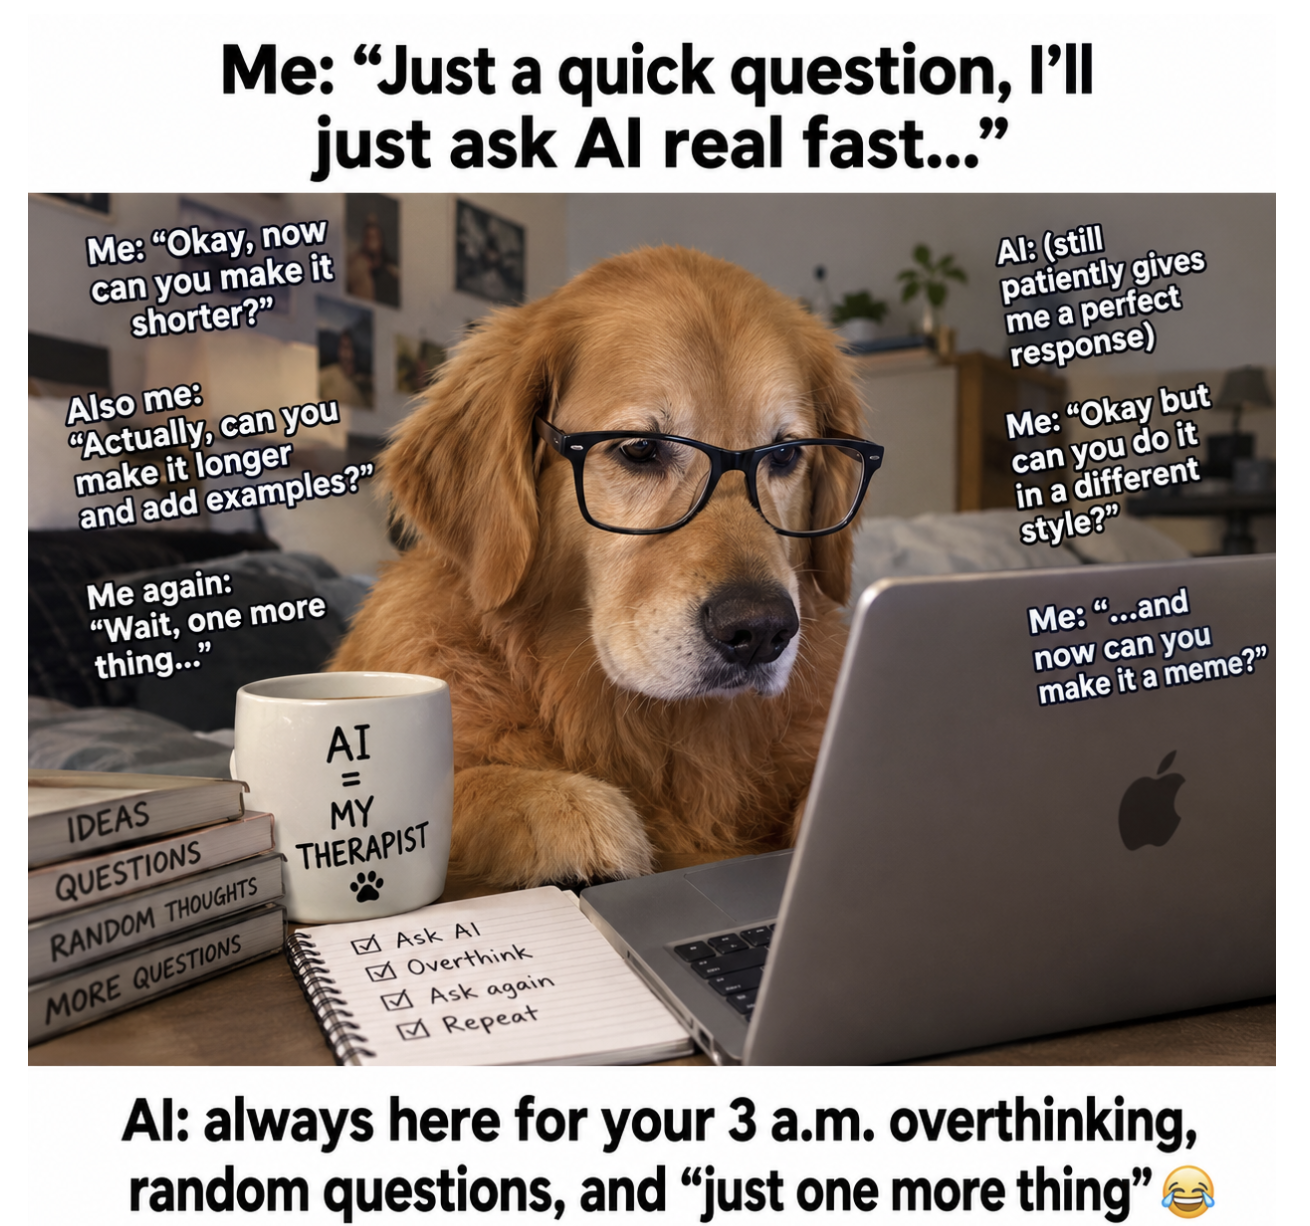
Picture Citation: Prompt “Give me a funny picture to show how AI can be wrong”, ChatGPT, 2026
AI Used: Grammarly for spellcheck and ChatGPT to make the image.
Why You Should Care:
You should care because it is affecting your ability to process and analyze information. Most people also blindly accept the answers they get without further questioning. Sometimes the information is wrong, and you are learning incorrectly. It also affects the environment, so while you may be learning incorrectly, you also are harming the world.
Something Intersting/I Did Not Know:
I didn’t think about was the idea of correcting the AI and giving it feedback. In the UT Guide, they mention giving feedback to better tailor your AI, where I normally just go with what it gives me (p.2). I also didn’t know there was a difference between open and closed AI; however, now that I do, I can more effectively use them to cater to my needs.
Something That I Can Apply To Academics:
I could use it to make a study guide but then go over the information myself. I can use it to form ideas or questions so that I have a focus point to study on my own. AI can also be used to find information quickly on Google; it may not be correct, but it gives you a starting idea. I know someone who asked it for the outline of how to format an APA citation; you then go in and fill it out yourself with your article.
Something Else To Share:
I am not very familiar with AI. The majority of this is new to me as someone who grew up in a less technologically advanced place. As an artist, the rise of AI art is frustrating. I want to be able to keep my creativity and ability to compose a work. Some ask for generated ideas or projects, but you need to prompt very specifically to get exactly what you want; when, in person, you can do it. The AI cannot see your idea in your head and may never get it exactly correct. It is taking away creativity and the value of real artists.
My goal for this project was to use the Spotify data given to us to see how streaming changed over different music genres between 2010 and 2023. I wanted to make a clear visualization that would make it easier to compare genres and notice the changes over time. I also wanted to understand how the way data is organized affects what we can learn from it. The dataset already puts music into categories like as Pop, Rock, Hip-Hop/Rap, Metal, and R&B/Soul, so those decisions shape the kinds of questions I can ask about music and popularity.
I put the Spotify CSV data into Flourish and looked at different graphs to display it. I thought that a line chart made the most sense because the data is organized by year and I wanted people to be able to follow changes over time. I also spent time changing the colors so that each genre had its own color and adding a legend at the bottom so the colors were easier to understand. One problem I noticed was that some genres, especially Metal, had much smaller stream totals than genres with much larger numbers. It made some of the smaller categories harder to see. I had to think about how to make the visualization easier to read without changing the scale in a misleading way.
My final visualization shows total Spotify streams for different music genres from 2010 through 2023. I used a line chart because it allows the viewer to follow each genre across the years and see how streaming patterns changed. I used different colors for the genres and placed the key at the bottom so viewers can identify each line. I also used “year” as the x-axis and “total streams” as the y-axis. My goal was to make the graph simple enough that someone who has never seen the dataset could understand what it is showing without needing a lot of explanation.
This taught me that choosing a visualization is not just about making a graph look good. The type of graph can change what a audience notices and how they take in the data. I also realized that the categories in the dataset affect the questions I can ask. For example, music can be categorized in different ways, and different genre definitions could give different results. Removing some of the categories also helped make my visualization less crowded and easier to focus on. At the same time, I learned that removing information can affect what the audience is able to see, so those choices need to have a reason behind them. If I did this project again, I would spend more time testing different designs and finding ways to make smaller genres easier to compare while keeping the graph accurate.