DH Final Project Proposal Week #6

For my DH final project, I want to do something with utilizing foreign sources. While not exactly a thorough idea so far, the basis is in using LLMs and AI models to collect, translate and process data from non-English sources, tying in to our lessons on data visualization and LLM usage, and I will be presenting it through Canva.

Class Notes

Review datasets from the data portal, to explore industry growth across the years. 
Especially interested in how to optimally use LLMs and AI, possibly something on prompting?
 Efficiency and strengths of open vs closed, maybe explore different models abilities on translation and source finding abilities?
List data from the portal in a visually appealing manner on Canva, using LLMs to find initial datasets and for translation works. 

Basic Proposal

Basic proposal: Using different LLMs to search for and translate foreign sources, potentially use them to help interpret said data, and use Canva to present these findings. Explores different AI models and what resources and data they draw from, translational abilities, my own ability to interpret and present said data. 

Goals

I attempted to use AI, specifically Google Gemini, to see if it was able to have any meaningful impact on my proposal, which wasn’t particularly helpful. The main points I want to focus on are AI translational abilities and how to find new sources utilizing different models, as they both pertain to my current IS project and how to properly visualize this data for other to more clearly see.

Sources

Screenshot by me

LLM Unit Report – Week 5 Brady Rahz

Process

What is the prevalence of AI in the modern workforce and how should colleges be preparing their students for a system that values its usability? It is my personal belief that AI and the knowledge required to use and understand AI tools should be included in college curriculums in order to better ready its students for the real world. Having used LLMs in my own personal life as well as the content we’ve studied in our class, I have come to the conclusion that learning about AI and the best ways to utilize it is essential for students our age seeking employment in a world that increasingly supports AI knowledge. 

How i want to use

In terms of how I intend to use AI in the academic space, LLMs can and have been extremely helpful in terms of locating sources I would’ve never otherwise thought to have used and translating works that I wouldn’t have had access to beforehand. While the wider use of AI seems to be encouraged across the modern workforce, and I think that at least being able to navigate AI tools, proper prompting and the capabilities of both open and closed LLMs is an important skill to either emphasize or at least keep in reserve when searching for a job, in my own personal experience I have found the most success with having AI models and LLMs process large amounts of raw data as opposed to searching through it myself. Going forward, I plan to continue using LLMs in order to search for sources that are more obscure to me, “Zero-shot prompting involves providing the model with a direct instruction or question without any additional context or examples”, according to Google which would imply most of my success will come from useful information that can be gleaned from much more broad requests, especially considering most of my sources originate in non-english languages and therefore are primarily included on non-english speaking websites. In a similar fashion, I will also continue to use AI in order to translate said sources, as I’ve had more success using ChatGPT and Claude to translate certain PDFs and websites as opposed to Google Translate and my own translational abilities.

how i won’t use

 As for a way I will not be utilizing AI for my particular needs, it will most likely be in regards to studying specific material for either quizzes or classes. Quoting the UT Ai Prompting Literacy Report, “As you write your prompts, you’ll need an understanding of the topic or domain you’re directing the GenAI toward. As you write your prompts, you’ll need an understanding of the topic or domain you’re directing the GenAI toward.” With the exception of closed LLMs, the tendency for AI to misreport information on specific requests leaves making study guides far too at risk for having misinformation to have them be worth it, whereas more general outlines that will already be reviewed by a human are much safer, as well as closed LLMs, which will only pull from pre-approved sources and thus have a much lower chance to give me bad information.

relic

For my relic I have asked an LLM, specifically Google Gemini, if it is trustworthy as well as its response. It doesn’t outwardly appear to be hiding anything. It did only link its own setup as a response though.

going forward

Going forward, I will be paying more attention to which situations I use AI in and how I prompt effectively. With certain requests, LLMs won’t be as effective, such as needing specific information for studying materials. For other, more general requests however, LLMs seem to be a much more usable tool to get what I want.

sources

Credits: University of Texas System. (2025, November). Prompt literacy. UT Aspire. Google Cloud. “Prompt Engineering: Overview and Guide.” Google Cloud, 4 May 2026, https://cloud.google.com/discover/what-is-prompt-engineering. 

Image is a screenshot of a Google Gemini Prompt generated by me

LLM Week #4 Blog Post

Actual post

The thing I was most surprised by this week was the usability and existence of closed LLMs as opposed to the much more popular open LLMs. Most of the time people’s biggest concern with AI usage, or at least mine, is the ability to hallucinate, which is substantially less likely to happen if you can directly have control over the sources it tries to employ. By having a closed LLM to only use exactly the sources I provide makes certain types of work way more trustworthy. This doesn’t mean closed LLMs are the greatest resource of all time, if I have the sources I already know I need then it makes summarizing or studying them a lot faster and more trustworthy. However, open LLMs are still going to be extremely helpful when actually looking for sources or work that I don’t already have saved, so when looking for articles on JSTOR or other archives ChatGPT and Claude are still going to be my go-to’s. Outside of learning the basics of how an LLM works, the UT proper prompting guide was kind of interesting to me in how many ways they thought of giving prompts to get a specific answer they want but I didn’t necessarily find it helpful as my AI usage is already pretty accurate for what I use it for. The image generation on ChatGPT is also pretty good, much better than I was expecting it to be. Just look how trustworthy ChatGPT is the photo it generated for me when asked what he looks like in the real world.

Citations

University of Texas, 2025, UT Aspire Prompt Literacy
ChatGPT prompt: give me a picture of chatgpt as a physical robot

Brady Rahz Data Visualization Blog #3 Project Report

DATA analysis –
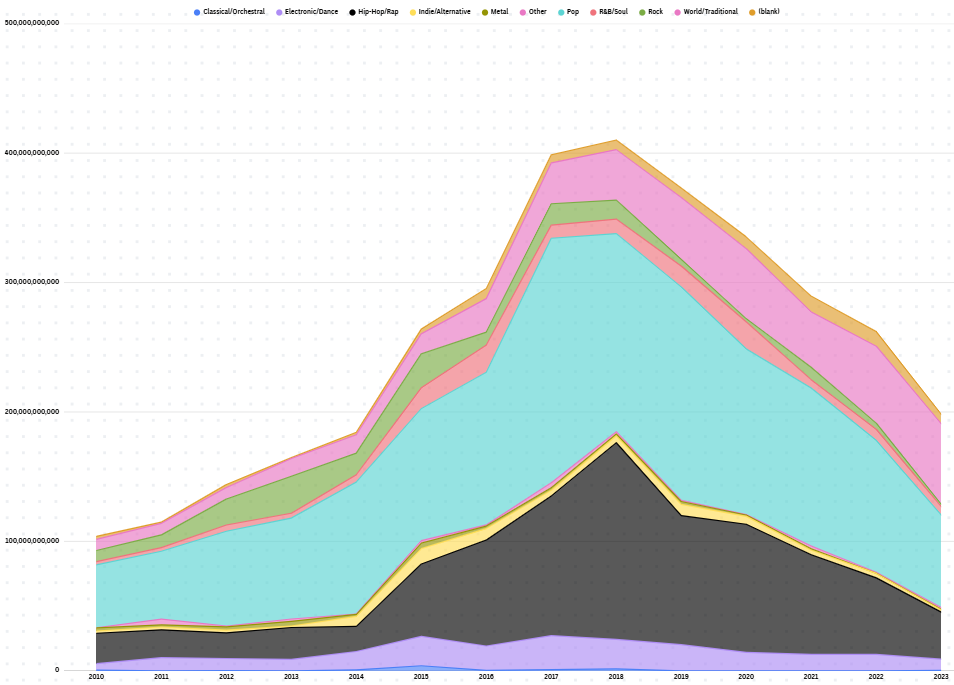
Spotify streams per year

For my module 1 progress report blog post, I will be writing about my efforts to try and track the total number of Spotify streams per year over the past decade by taking the yearly total number of streams per genre and adding them all together. This seemed to be a fairly solid plan, with an achievable goal and usable data to reach it. During the initial graph making stage, I was primarily experimenting with grouped bar graphs, as I thought I could separate each group into a year and then have a final group at the end for aggregate totals, however this led to an abundance of visual nonsense and the graph was just rather difficult to read. 

Graphing

From there I settled on the much more usable area graph, and had substantially better luck organizing by genre and year. This would ultimately end up being the graph I stuck with, as it clearly communicates how much was being streamed and when, though I am curious if there are any other types of graphs that could have gotten the same effect done. Editing the graph in Flourish was a bit of a learning curve, and once I was able to resize my graph I spent most of my time attempting to make it more readable through coloring and text placement.

The Issues

My first main obstacle was trying to save my graph. I had, unlike most people, opened flourish through Canva rather than going directly through Flourish itself. For this reason I had a substantially different UI to work with during the actual graph editing phase, but was also left unable to publish my graph, as I couldn’t find the button for it. I tried a number of other ways to get my graph to appear in my Voices post, such as embedding the link from Flourish’s copy page or downloading the graph and just including it as an image in the post itself. Neither of these worked either.

The SOlution

Eventually I was able to come up with a solution, taking a screenshot of the graph and using a Voice’s template that already had an image included would allow me to replace the image with my own rather than saying it was too large a file or that Voices was incapable of using the selected file. Not sure why it wants to be like that but it worked out in the end.

The Conclusion

The actual process of gathering data and trying to represent my findings seems to be straightforward enough, and I think I have a generally pretty good understanding of how I should be trying to present my data in a clear and concise manner. The real difficulty for me came in trying to learn how to use Flourish and Voices, with Flourish being a new piece of software I just don’t have much experience with, and Voices limiting my ability to post pictures for reasons I still need to use work arounds for. Hence the small graph photo rather than an actual readable sized graph photo. Still learned a lot from it though.

Post #2: Voice Blog

Wooster Hazing frequency

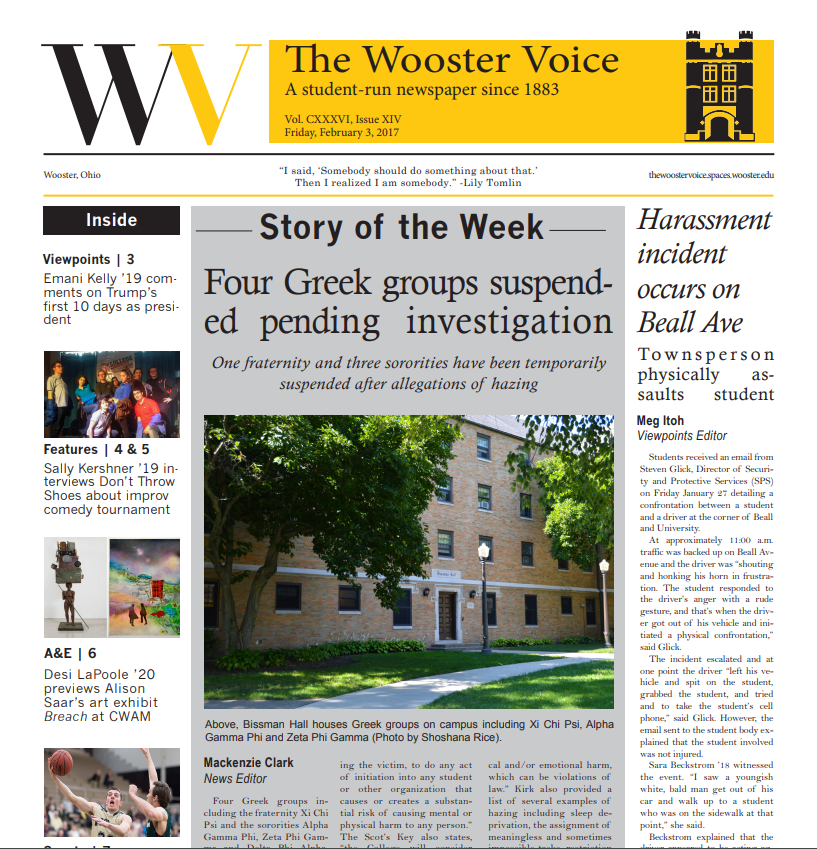
My study of the Wooster Voice would track how often articles featuring or about hazing have appeared in the paper

The questions that we discussed as a group mostly pertained to what types of articles appeared in the Voice throughout the years and how often the paper had been engaged in plagiarism, though since I couldn’t find that article I’ve settled for the next best thing; hazing. It’s a topic I’ve noticed a few times throughout my viewing of the Voice and would assume it’s one that has become more frequent throughout the years. I think it’d be interesting to see the students perspective on something that’s recognized as a pretty frequent issue across the country.

My dataset and spreadsheet would most likely search the Voice’s archives for articles containing the words “haze”, “hazing” or any other related terms and sort by inclusion in the title and body, frequency of how often the word is used throughout the article, and the time that issue came out. I imagine this would be a pretty basic way to track not just how often students fin it interesting to write about but increasing with the College’s attempts to stop it. It would also be interesting to compare this to other college newspapers and general media coverage of hazing, which I feel has been ever increasing in recent years.

For privacy, names wouldn’t need to be included, authors or those included in the articles otherwise, though anyone with access to the Voice’s archives could theoretically look up the articles for themselves to find the potential increase in reports.

Image Credit: “Wooster Voice Front Page” 2/3/17 https://openworks.wooster.edu/cgi/viewcontent.cgi?article=1014&context=voice2012-2020

big first post

I’m Brady from right here in Wooster Ohio. My majors are English and East Asian Studies, and I enjoy reading and cooking. none of my pictures will upload 🙁

interested in what all we’ll be doing with the blog posts

my muddy point is probably whether or not we’re exploring the data itself or the methods of collecting and using it.