The Ethics of Magazine Data Collection

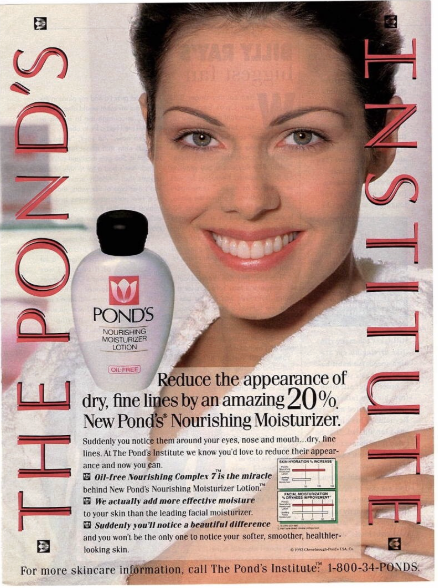
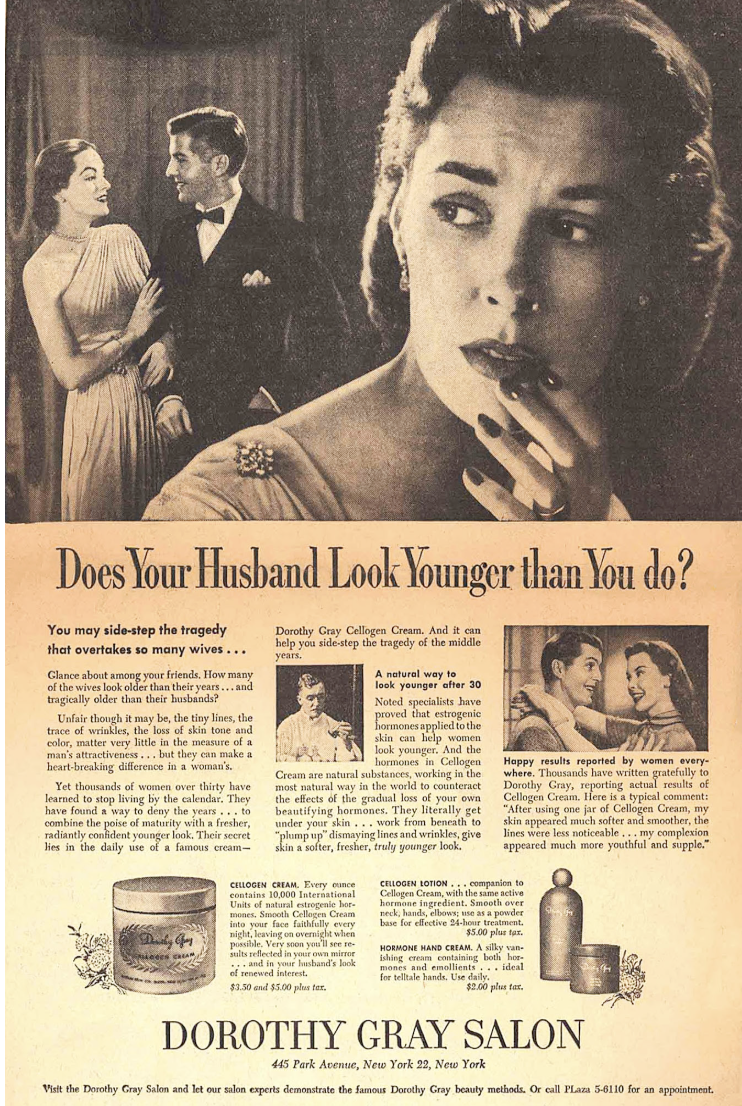
A Ponds Ad from the 1990s illustrating a woman advertising a facial moisturiser
A facial moisturiser ad from the 1990s

At this preliminary stage of my project, I will build a small database of facial moisturizer ads from Cosmopolitan and Essence (or Vogue), two long-running US women’s magazines, from the years 1985, 1995, 2005 and 2025. For each year, I will sample the same editions and collect maybe 5 or 10 moisturizer ads per magazine per year depending on how much is available on the archives and libraries. Each ad will be in a row, with columns for the year, magazine, the brand, who presents the product, who the audience is, health claims and scientific language. I can only document what is explicitly stated at this part of the process. I will then use Flourish to visualize the patterns over time between the two magazines and use Canva to build an exhibit that displays the ads with details, alt text and sources next to it. I will look at the patterns in my sample (the four dates) the presenters, audience, claims, language and how it has shifted over those years and what that suggests about cultural values/norms and others.

In data collection, beng ethical is one of the most important steps to carryout through a project. “When building a data set we need to consider if the source and method we’re using to collect
the information is the most accurate and complete possible” (Barr, 2021). This quote reminded me to think thoroughly about ethical areas that matter most. They would be: data collection, representation, transparency, publishing, context, community representation, accessibility and AI use. When it comes to race, gender, age, I do not want to guess out of the possibility of misrepresenting someone so, i plan to record only what an ad explicitly states or shows in caption or in sources about identity. Transparency is also an ethical area I will address. I want to document everything necessary so that anyone looking at my chart and exhibit can see everything that was done. I plan to structure the spreadsheet such that one row per ad, document my sampling method, any uncertainties or exclusions and why i chose those 4 years.

My Canva exhibit will have real ads, with real people so i ave to give context to the brands advertised. Also with Canva, I will use low resolution but clear images and write captions. Community representation depends on the magazine i use. Right now, I have decided on Essence, which was created for Black women so I want to use that history to also interpret the ads so that I can better explain the beauty standards/cultural norms. I am not trying to use one magazine as a default and the other as an exception for a race conversation.

I want to create a chart and a digital exhibit experience that is inclusive so that it “can be used by as many people as possible”(Cidoncha, 2026). To do that, there are a few things to consider and for now, I pla to add alt text to every ad and the chart, use a dark and light mode version, be mindful of colors and contrasts as well as font size and type. Also, if I use AI at any point, I will double check for facts because AI may misinterpret something about the ad or have a bias as discussed in Gender Shades. I want to do everything myself, to avoid adding to the environmental costs (especially if this is something I can do completely without AI). That is the plan but I will always disclose any AI use at the end to avoid any plagiarism concerns and transparency issues.

Credits: Barr, C. (2021). Building Your Own Data Set: Documenting Knife Crime in the United Kingdom. In L. Bounegru & J. Gray (Eds.), The Data Journalism Handbook: Towards A Critical Data Practice (pp. 49–54). Amsterdam University Press. https://doi.org/10.2307/j.ctv1qr6smr.10

Cidoncha, C. (2026). Page restricted. Iubenda.Com. https://www.iubenda.com/en/help/181591-inclusive-design/

Vintage 1990s magazine print ad the Pond’s Institute skin care Lotion Health V2. (2026, July 10). eBay. https://www.ebay.com/itm/204803412532

AI use: No AI was used to write up this blog post.
Final Project Proposal (Tentative)

Whitfords. (2023, November 25). Surface tensions: The underlying truths of skincare advertising. Whitfords. https://www.whitfords.co.uk/surface-tensions-the-underlying-truths-of-skincare-advertising/

My final project is about analyzing skincare advertisements over time from 1980s to 2000s. I am yet to specify the time frame.


I have a couple of research questions: Is there a shift in who is presenting the product over time?

What are the gender trends?

Who is the product marketed for? Are there any changing health claims? Scientific language trends?

Is there a change in the “marketing” words and taglines over time?

I want to think more about whether the tensions involved are historical, cultural or human (gender). Currently, I am aiming towards gender as an issue or something worth exploring from different angles. I may come up with something cultural.


My primary Digital Humanities track is Canva. I thought it would be best to create a digital exhibit of the advertisements over time and possible one that can be scrolled through and zoomed in on (for some detailed context). I am taking ads from Duke’s digital Ad collection or Penn State University archives for now. I will look at when they were shared, who they are for, who or what is on the ad and put the findings in a digital exhibit.


Some of my preliminary sources are found in the Moodle under our course: Nathan Yau: Understanding data

Duke Digital Repository and the Penn State University archives

ch 1 “The Basics” from The Wall Street Journal Guide to Information Graphics 

Mikel Djukic “Perception Deception” Data + Design 

The Data Visualization Catalog “What Do You Want to Show?

Canva tutorials

Citations

Library guides: Advertising: History and archives: Archives: Digital collections. (2014). Psu.Edu. https://guides.libraries.psu.edu/adhistory/archives

Home. (2025). Library.Duke.Edu. https://library.duke.edu/

AI For Augmentation, Not Automation: A look into AI use by Students

AI is has been integrated into every part of our digital lives from Google Searches to PDF summarizing. It takes us away from the past academic procedures to the new automated and sometimes augmented academic processes.That carries a lot of concerns surrounding trust, cognitive ability, ethics and hard work. The question now becomes, should college students use AI to complete their academic tasks? At first I was going to say no, but then I wanted to break down the question and highlight the keyword, complete. Focusing on that word, I now say yes.

I think AI is increasing cognitive debt, reducing the confidence of students and making so many students lazy. Alongside this, there are other negative effects of AI on students. I stand with that, but looking at the question again, I do want to refer to this quote from the article: “Beyond its implications for specific subjects and disciplines, the advent of AI demands a broader, holistic reassessment of the nature, scope and purpose of higher education today” and say that the purpose of AI in higher education should go towards the direction of grammar checking, proofreading and asking questions (Report – AI and Education, 2026). Students should use AI to complete their academic tasks, where complete involves grammar checking, follow up questioning to stimulate brain function and asking for clarity on instructions.These are things that save time, allow students to feel calm when they do engage in last minute work and feel at ease when they suddenly have a question about the assignment at 2am and cannot email a professor just to “make sure” they understand the assignment prompt.

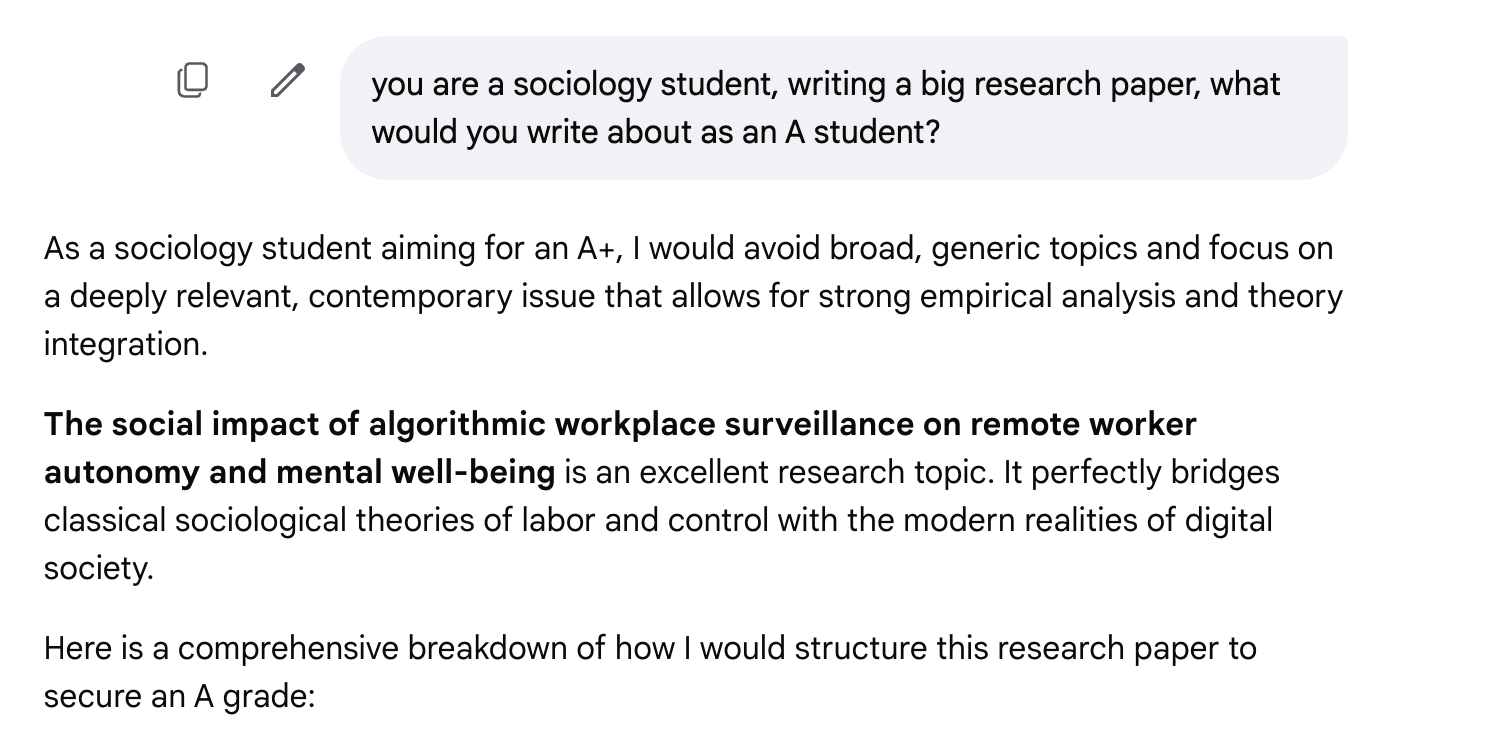
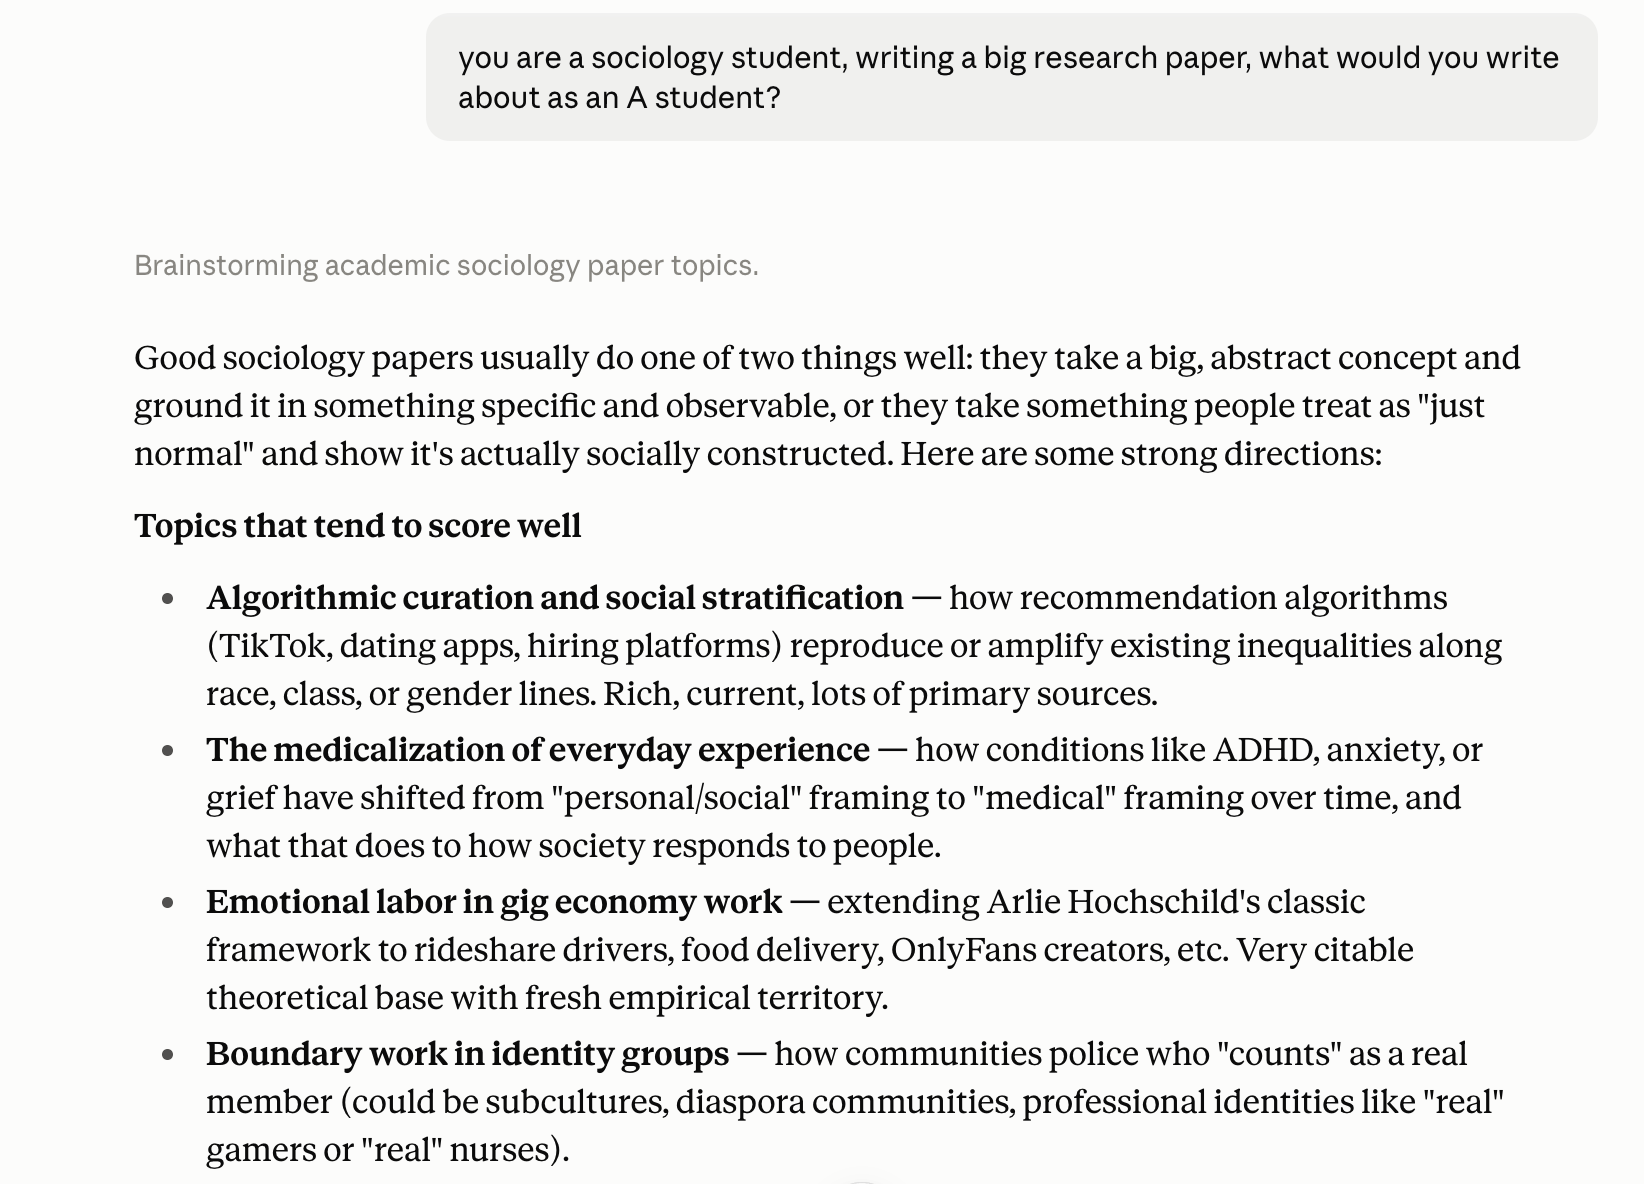
To simply show why AI is such a complicated tool, I tested out Google Gemini to see what it does best and does not do best. AI can surely be a helpful tool especially when a student has exhausted all other options or is running out of time. AI should definitely not replace initial thinking and writing but I think it can surely complete academic work as long as the prompts are drafted correctly and the student knows what to use it for and what to not use it for. I decided to ask Google Gemini to give me ideas for a research paper to write as a “Sociology student”.Then, I run the same prompt in Claude AI. In another instance, I asked Gemini to explain the snake and newts arms race to a student who knows nothing about biology. After running the Sociology prompt in both AI’s, I noticed a couple of differences. With Gemini, it gave just one topic with a breakdown of the paper format, while Claude gave a list of topics that tend to do well (without referencing where it knows that from). I then asked the two AI’s to explain the arms race for biology and they both did a good job at breaking it down. I tend to se and will use AI to explain concepts but contrary to popular belief, I would not use it to draft topics as a at first step. I would rather ask people, or sit and think about something and then I would run the same prompts through different AI’s.

I have realized that both AI’s read requests very differently. I was expecting both to give me a couple topics but I noticed that Google Gemini takes an objective approach than Claude and that could be for a couple reasons. To me, it seems like Claude is used to learning from a user’s language, tone and nuances but Gemini comes off as objective at every chance (even follow up prompts). I think what is most important is experimenting and knowing which AI to use for what. “In short, AI should be used to augment and enhance curiosity, creativity, and learning, not automate them” (Report – AI and Education, 2026).

What I know is that it is best to experiment, know what you want to use it for, and decide what you value most (cognitive ability, ownership, fulfillment). We once went on without Gen AI and we were quite alright so I feel that if we have to move with technology, then we should establish what we value most when using the AI. As a student, I think about how much ownership I want, and the confidence and originality. After students consider that, then I would say that college students should use AI (from AI writing assistants to advanced Gen. AI’s) to complete academic work if completing involves grammar checking, asking for clarification, using it without loss of confidence, and getting explanations with the ability to check the AI for facts and hallucinations. Lastly, we need knowledge on biases, ethics and fairness so that we as students can identify them. I would check for hallucinations, company statements on bias and asking AI follow up questions.

Citations APA

Report – AI and education. (2026). Mit.Edu. https://aiandeducation.mit.edu/report/


LLM

A meme about AI taking over.

I think some people feel like AI is this big black hole of countless data and there have been theories of AI taking over and someday attacking us/ ruling over us. Thats all very interesting but I think its best to learn about what to put into AI and what not to put into it as well as how to manipulate it.

I would say that I never thought about the fact that GenAI has a limited amount of resources to work with. I always thought it had an unbelievably vast amount of data to access.

I am learning a lot more about hallucinations which are “incorrect information generated from patterns that do not really exist”(The University of Texas System, 2025, p. 3). It has definitely happened many times before but I am now realizing that what I do in response to that, is asking the AI if it telling the truth and that if it truly does not know, it should let me know (it works!). For my academics, whenever I have to use AI, I try to run the same info through at least two AI’s and then take bits of information to a Google search.

I think the concept of closed and open LLM sort of addresses many privacy worries of using AI. A lot of people become unknowingly dependent on AI and end up putting their private information into chats. I think closed LLM could ease such worries in the sense that it is confined to certain people in an organization and as long as we minimize the access to our privacy, then it is possible to let go of such worries.

CITATION: The University of Texas System. (2025, November 11). UT aspire prompt literacy. The University of Texas System. https://utsystem.edu/documents/docs/general-documents/2025/ut-aspire-prompt-literacy

IMAGE: boat-dog. (2025). Reddit. Reddit.Com. https://www.reddit.com/media?url=https%3A%2F%2Fpreview.redd.it%2Fi-asked-chatgpt-to-make-a-meme-showing-how-youd-treat-me-if-v0-6jzvle5mbfue1.jpeg%3Fwidth%3D1024%26format%3Dpjpg%26auto%3Dwebp%26s%3D0eb800608e9e851a4e08dc14e279376ff858e1ee

The Rise and Fall of Hip-Hop on Spotify

After taking a look at the dataset and seeing the number of streams for each genre over the years, I decided to ask which genre dominated the streaming era of 2010-2023. I also wanted to find out what year had the most streams, and come up with some reasoning. I noticed that there was no streaming of classical music in some years and I found that to be worth exploring. I wanted to use this data to think about what the shift in music genre trends have been over the years. After asking these questions I did think about how this data is represented and if the sample is biased.That is because Spotify’s user base could skew towards certain countries, ages and income levels so I have to consider how representative the sample is.

I used Flourish to visualize the data. I uploaded the dataset into the software and decided on a line graph because I felt it was better at projecting changes/ growth over time and then I adjusted the space on the x and y axis. I also changed the colors of the lines and the background to be visually appealing and easy to see. I gave the data a title that best explains the visuals and continued to play around with colors and spacing until I found the right features. What surprised me while constructing this was how much the Hip Hop curve changed over the years. I saw a drastic fall that I was not expecting because it dominated and fell drastically.

Line graph showing total Spotify streams per music genre from 2010-2023, with Hip Hop spiking sharply around 2018 before falling.

The graph shows Hip-Hop/ Rap going from about 23 billion streams in 2010 to 152 billion in 2018 and that dominates every other genre on the graph. Not long after, it crashes to 36 billion and ends up being lower in streaming count than traditional music. I think I did well to ensure that the graph really visualized the rise and fall of Hip-Hop streams by enhancing the curve with a gap and flattening all other genres at the bottom (even with adjustments you can see the difference). For limitations, I would say that I did experiment with Flourish to try to expand the gaps between the other genres but they ended up looking flattened near the bottom and in general, they are pretty close to each other, making it harder to trace.

I will say that the graph is very helpful at making numerical conclusion that I can give my own probable reasoning to with the help of additional research. I did not think there was much of an ethical concern that came with this particular data because I do not see any personal information or identity tied to the figures.

Making this chart taught me that visualizations are very important and require intentional detail because every point you place on the graph shares a piece of key information that can bring up questions and thoughtful conversation among the audience. The steep visualization of Hip-Hop streams tells us about its rise and fall, but because it doesn’t tell us why, we as the audience can use this visualization to come up with thoughtful reasons why the genre performed the way it did. If I were to do this again, I would represent the other genres more clearly (possibly creating wider gaps by using smaller units on the y axis).

Credit: Data from Intro to Digital Humanities course. Chart made with Flourish.

Line, bar and pie charts by Flourish team

Data blog post

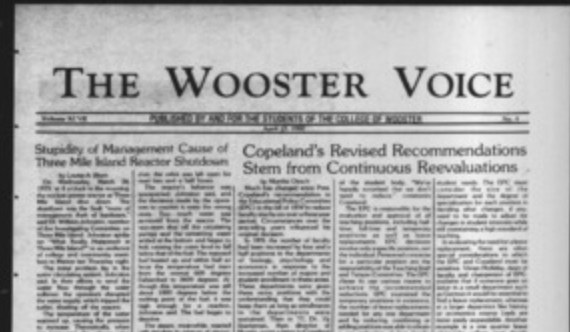
A picture of a Wooster Voice edition
The Wooster Voice. (2026). The voice: 1971-1980 | “The voice” student newspaper collection | the college of Wooster. Wooster.Edu. https://openworks.wooster.edu/voice1971-1980/

After looking at the digitized Wooster Voice archives I would be interested in exploring how exclusive the newspaper was to the college community back when it was the print version only. I would also want to look at the kinds of topics it covered and content distribution (eg. whether political news was more than campus gossip). I was curious about who the Voice’s target audience is today versus who it was written for and how that affects exposure to the campus community. These questions are important because they reveal how students have made sense of their experiences on campus and how student culture has evolved. Largely, in DH, they give a range of possible data points that can be researched.

For my questions, I would organize my spreadsheet so that each row represents a single article from the Voice archives. For example, with the content distribution question, each column would have publication date, title, author, topic category (politics, entertainment, arts, sports, greek life etc). I could also do how many student features, their class year, major, and the kind of topics portrayed. For the vocabulary, i would use short words, category kid of labels like politics, alpha, gamma, greek, basketball, administration, student life etc. Anything that makes SEO efficient and also just to have each article coded with specific words/terms.

Data privacy is a significant concern in this project because exposure has changed from print to digital and that comes with ethical concerns especially regarding student features from the past. They may not have anticipated their college time to be digitized years later and very accessible. My spreadsheet would include identifiable information like names and quotes so i would probably ask whether it is necessary to record very personable information or using pseudonyms for certain topics where someone may have said something very personal and exclusive to campus community like the gossip section (that maybe they don’t want someone outside to know).