
Well What is Activism?? – Eric S.

My final digital humanities project will focus on the History of Student Organization Political Activism as reported in the Wooster Voice from 2000 to 2020. For this final project, I will manually read through every publication of the Wooster Voice from the start of 2000 through the end of 2020, identifying political acts from different student organizations and classifying them into two categories: on/off-campus and location (local/regional/national/global). I will create visualizations of this data using Flourish to explore changes in college policy on school-sanctioned student political activism and the political events that drew Wooster students’ attention at the time. This project does have three ethical concerns that need to be addressed: data collection and privacy, community representation, and accessibility/universal design.

I first want to address community representation with this quote from Yau: “You’ve seen how that data can be valuable to an individual. What if you look at the data from many individuals in aggregate?” One main concern with this project is that it does not represent the entire campus community at that time. Because I am sourcing this data from archives of a student newspaper, my research is limited to what the reporters, writers, and editors of the Wooster Voice cared about and were involved in. Another consideration is that the political state of the nation, or even the surrounding Wooster area, also affects what gets reported. So my project is based on the personal lives and interests of the many authors of the Wooster Voice from 2000 to 2020, as well as what I consider to be activism.

As I am the only person working on this project, another thing that I, as well as any reader, must consider is my personal bias. “The easiest way to show off with spectacular data is to fabricate it.”-Kayser-Bril. While I personally have no intention to purposefully misconstrue data in any way, I may inadvertently do so, or the writers of the student newspaper may have. As we’ve seen in discussions of data collection paired with our deep dive into Language Learning Models(LLMs), there is no way to escape bias of any sort. The writers’ personal bias on what to report on and my personal bias on ‘what is activism?’ is what makes this project just a very brief and topical analysis. In order to help circumvent some of my own personal bias, whenever I encounter a story about a student organization and am hesitant on whether or not it is a form of political protest, I will ask either a peer or a person of authority for their opinion. This is not a perfect plan, nor is it free from error or bias; however, it’s the best I got.

OneTrust. (2020). Privacy 101: Data Subject Rights [Video]. YouTube. https://www.youtube.com/watch?v=C3hio0WkRHg

My final consideration is on the presentation of this project in general int terms of who can and/or can view, consume, and understand it. Firstly, when it comes to the design of the data visualizations themselves, I will ensure that the design is inclusive, especially with color and typography. Readability as well as digestibility are the two most important things when it comes to communicating with data. Providing an interpretation for the data is necessary; however, viewers should also be able to understand and draw conclusions from the data themselves. As this project is limited to this class, my personal goal is that it’s accessible to that and similar audiences; this is to say that the project will not be inclusive on a national level.

Citations:

  • Ervin, W. (2013). Data Points: Visualization That Means Something. Nathan Yau. Information Design Journal, 20(3), 294–295. https://doi.org/10.1075/idj.20.3.09erv
  • DataJournalism.com. (2019, February 6). Become Data Literate in 3 Simple Steps. DataJournalism.Com. https://datajournalism.com/read/handbook/one/understanding-data/become-data-literate-in-3-simple-steps
  • OneTrust. (2020). Privacy 101: Data Subject Rights [Video]. YouTube. https://www.youtube.com/watch?v=C3hio0WkRHg
  • Declaration of AI Use: No AI was used in the ideation or construction of this project, gram marly was used to correct grammar.

Eric S : Project Proposal Blog Post

For my final project, I am absolutely clueless about what I want to create a digital humanities project on. I know I want to create data visualizations and am open to story maps; however, I don’t know what data to use. To start generating ideas, I went to www.kaggle.com to search for a dataset to help me form some rough ideas. So far, the datasets that I am interested in transforming into a project are: 

  • Online news Popularity
  • Instagram Reels: Virality & Engagement Trends 2026
  • Messy E-Commerce Sales Data
Burg, M. (n.d.). Abstract pink purple 3D Render. unsplash.com. https://unsplash.com/photos/abstract-pink-purple-3d-render-kE8-rUKjtQU

I actually have come up with a very crude digital humanities question; however, I am not very confident in its feasibility or whether it would be complex enough for the class. The project would be exploring the history of The College of Wooster student organizations’ political activism as reported in the Wooster Voice from the years 2000 – 2020. For this possible project, I would literally search all the Wooster Voices published between the start of the 2000 academic year and the end of the 2020 academic year. This question arose after this past weekend being homecoming, and there were a lot of alumni who spoke about their respective student organizations being very politically active off-campus. I’d mainly be looking at how invested was the student body about these policy changes as off-campus protesting is heavily restricted at the college today.

LLM Post: Eric S

The most interesting thing that I’ve learned about Language Learning Models(LLMs) this past week was that they don’t actually try to predict the right answer for the prompt, but that they purely go off of statistics with a little bit of context. I found the term ‘Stochastic Parrot‘ from Emily Bender’s lecture to be a good nickname for the process that LLMs use to answer any given prompt; similar to real parrots, they just repeat and string together words and/or sentences without knowing the meaning behind them. 

3Blue1Brown. (n.d.). Transformers, the tech behind LLMs | Deep Learning Chapter 5 [Video]. YouTube. https://www.youtube.com/watch?v=wjZofJX0v4M

I found the video above from 3Blue1Brown to be a very understandable overview(for someone who hates computer science) of a bit of the background and process of transformers to LLM’s to the generative AI that we see now. And it really helps to illustrate not just how they work but also alludes to how they can go wrong and create negative feedback loops and hallucinations mentioned in the article by Jon Cheung, ‘How AI Image Generators Make Bias Worse.’ With how AI datasets are bound to have some form of bias in them, and then as generative creates more content representative of that bias, it then feeds back into itself, amplifying the biases even more.

Citations:

  • 3Blue1Brown. (n.d.). Transformers, the tech behind LLMs | Deep Learning Chapter 5 [Video]. YouTube. https://www.youtube.com/watch?v=wjZofJX0v4M
  • Lis, & Lis. (n.d.). How AI image generators make bias Worse. London Interdisciplinary School. https://www.lis.ac.uk/stories/how-ai-image-generators-make-bias-worse
  • Harvey Mudd College. (2024, November 20). Emily Bender: “Don’t Try to Get Answers from a Stochastic Parrot” | 2024 Nelson Speaker Series [Video]. YouTube. https://www.youtube.com/watch?v=5m0ZolIb2hA
  • Declaration of AI Use: I acknowledge the use of Generative AI tools in writing this post: I used Grammarly to refine the language after drafting on my own, I declare that I reviewed and edited the contents as needed and take full responsibility for the content of my submission. All of the information I presented is complete and accurate.

Black Super Bowl = Genre Streams???

chart visualization

–

Eric S. Data Blog Post

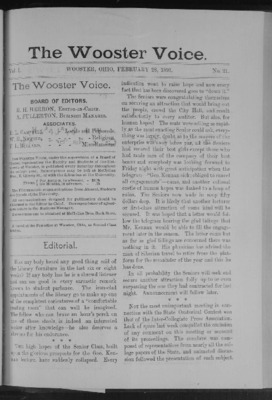
For this blog and data questions I used the February 7th, 1891 edition of the Wooster Voice, edited by R. H. Herron and A. Fullerton. This edition was very notable as it was written shortly after the voices inception in 1883 and it is very clear that during this period, the voice was still finding its voice. Some questions that were generated from this edition were: How often were/are non standard English conventions and other languages featured in the Voice; As well as how often other colleges and universities mentioned in the voice and for what reason. These questions stemmed firstly because in the February 7th, edition, there is an entire column written in what seems to be pig latin, and there is an entire section dedicated to the happenings of other universities such as Yale, Columbia, and Dartmouth.

Editors, Wooster Voice, “The Wooster Voice (Wooster, Ohio), 1891-02-07” (1891).The Voice: 1890-1900. 18.
https://openworks.wooster.edu/voice1890-1900/18

If I were to create a data sheet, tracking how often other colleges were mentioned in the voice I would make columns for: name of college, date, create a keyword library for how they were mentioned or what they were mentioned for in simple categories(sports, student organization, staffing changes, etc.), and then a summary column quoting what they were mentioned for.

In this proposed dataset I do not think that privacy would be much of a concern as much of the information spoken about in this section does not mention specific people by name except for the case of a university hiring a new professor or president. Instead I would be very careful and diligent in my citing of each edition of the Wooster voice used in the data set.

Introduction

Image taken from Pinterest; Author unknown