Module 3 Project Report: DH Ethics

(I just realized that I saved this post in my drafts instead of posting it, my apologies)

Project Overview

For my final Digital Humanities project, I want to explore environmental ethics, specifically how human land use around national parks has changed the landscapes and habitats that these parks are intended to protect. My research question is: How has human land use around national parks changed the landscapes and habitats that parks are intended to protect?

My first inital thought was to present my data throught storytelling and digital mapping but after talkign with my classsmates, I’m also thinking of using a timeline through Canva. I am interested in learning more about these methods because they can help me communicate environmental changes to a public audience. However, as I begin planning this project, I also need to consider the ethical responsibilities involved in collecting environmental data, representing places and communities, and sharing my findings online.

Data Collection, Accuracy, and Transparency

My biggest ethical concern for this project is the environmental impact of artificial intelligence. Because my project focuses on environmental ethics, I want to make sure that the process of creating my project does not conflict with the environmental values I am researching. Generative AI requires computing resources, and the data centers that support it consume electricity and water. The environmental impact can also include the production of computer hardware and the resources needed to manufacture it.

In an article from MIT News titled “Explained: Generative AI’s Environmental Impact,” Adam Zewe discusses the environmental costs of training and operating generative AI systems. Elsa A. Olivetti, an MIT professor researching materials science and decarbonization, explains, “When we think about the environmental impact of generative AI, it is not just the electricity you consume when you plug the computer in. There are much broader consequences that go out to a system level and persist based on actions that we take” (Zewe, 2025). This quotation shows that the environmental impact of AI extends beyond an individual’s immediate computer use. It includes the infrastructure, electricity, water, and hardware that make these tools possible. This is especially important for my project because I want to explore how human activities affect natural landscapes and habitats. I need to consider the environmental costs of the digital tools I choose to use, not just the message my final project communicates.

Representation and Bias

A second ethical concern is how my maps might influence the way people understand national parks and the communities surrounding them. The colors, boundaries, symbols, and information included in a map can shape its message. For example, a map that highlights housing developments and roads in bright colors might make surrounding communities appear to be threats to conservation, even when the actual relationship between development and habitat loss is more complicated.

By acknowledging these different perspectives, I hope to create a map that informs readers without oversimplifying the relationship between human activity and environmental protection.

Publishing Findings and Providing Context

The National Park Service’s discussion of land use around parks in the Greater Yellowstone region explains that parks can be affected by activities and natural processes occurring on neighboring lands. This supports my research question because it demonstrates why environmental conditions must be considered beyond park boundaries. It also reminds me that a map showing land-use patterns should not be treated as a complete explanation of an ecosystem.

To address this concern, I will include a title, explanatory captions, source citations, and a short description of the methods used to create my maps. I will identify the geographic area and time period represented and explain what the visualization can and cannot demonstrate. I will also provide links to the original data and research whenever possible, allowing readers to investigate the evidence further.

Accessibility and Public Engagement

Accessibility is another ethical consideration because one of my goals is to communicate my research to a broad audience. An interactive map might be visually engaging, but it may not be equally useful to someone with a visual impairment, someone using a screen reader, or someone with limited internet access.

Digital storytelling may help me make the project more engaging by connecting geographic information with explanations of habitat disruption and conservation. However, I will need to ensure that the storytelling does not sacrifice accuracy for an appealing narrative.

Media and Visual Evidence

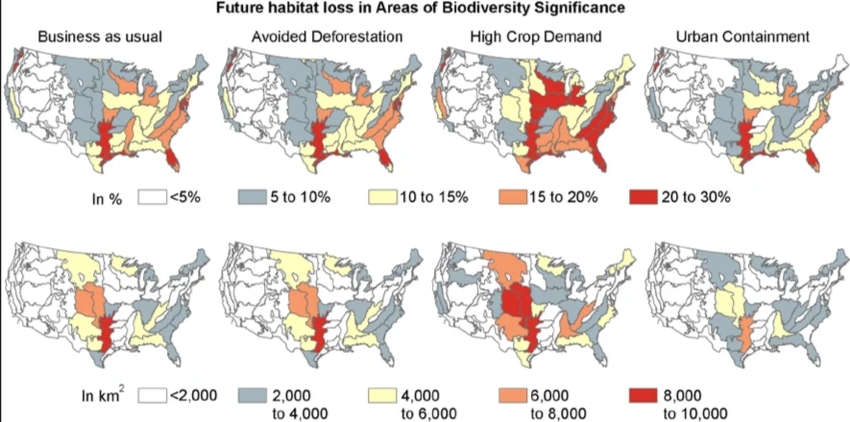
The following map is an example of the type of visual information that inspired my project. It illustrates how geographic information can help viewers consider the relationship between developed areas and natural landscapes.
For my own project, I would like to develop a more focused map that examines a specific national park and the surrounding land over time.

References

Zewe, A. (2025, January 17). Explained: Generative AI’s environmental impact. MIT News. https://news.mit.edu/2025/explained-generative-ai-environmental-impact-0117

National Park Service. “Land Use.” Greater Yellowstone Inventory & Monitoring Network. https://home.nps.gov/im/gryn/land-use.htm.

“Habitat Destruction Statistics.” https://ar.inspiredpencil.com/pictures-2023/habitat-destruction-statistics.

Project Proposal (Week 6)

I knew I wanted my preliminary final project topic to focus on environmental ethics, but I wasn’t sure of the exact topic. Then I actually thought back to the first blog post where we shared fun facts about ourselves, and mine was hiking and traveling to National parks. I know I have a passion for that, and it’s something I am interested in, too. One topic that is relevant to me and something I’m learning in my other class is habitat disruption and land use. So, my goal is to try to connect the two, so I came up with this research question: “How has human land use around national parks changed the landscapes and habitats that parks are intended to protect?”

The Primary DH methods that I would like to use would be digital mapping or storytelling. I want to build my knowledge in those two methods because they interest me most and help me engage better with the topic. That also supports public-facing work, which can help my audience understand my thoughts and ideas better. The map below is an example of information I would use for this project.

This image was taken from the Habitat Destruction Statistics Website. Habitat Destruction Statistics.

Just like this map portrays above, I want to show that the relationship between protected land and surrounding development is particularly visible.

Module 2 project report: LLMs

Should College Students Use Generative AI for Academic Work?

Questioning and Framing

After reading the MIT Report on generative AI in higher education and thinking about my own experiences with AI, I believe college students should not use generative AI to complete the academic work they are expected to do themselves. AI can be useful, but there is an important difference between using a tool to support learning and using it to avoid the learning process altogether.

The MIT report reassures me of my opinion, but the author explains that the biggest concern is that “many uses of AI deprive students of the opportunity to learn” (MIT). This stood out to me because the purpose of college assignments is not to get the correct answer every time. Assignments are supposed to make students practice thinking, solving problems, and making decisions with their personal judgment.

My biggest problem with using AI for assignments is the lack of critical thinking skills. It is very easy to have AI chat bots complete your assignments without having to think about it. The MIT report stated that “getting the right answer from a chatbot can create the illusion of learning”(MIT). If AI immediately removes that struggle, students may finish the assignment without actually developing the skills the assignment was designed to teach.

Process

The approach we took really helped me understand the key differences between human and AI answers. Everyone in class was given the same prompt, but the twist was that some had to answer with AI and others answered with their judgment. The results showed that, in the limited time to answer, the critical thinkers elaborated with our groups and finished in the allotted time, while the AI users were still writing answers. We also found that people using their own knowledge were able to recall the answer and the question that was asked more promptly, just by writing it out.

This process helped me distinguish between using AI as an academic shortcut and using technology as a learning tool. If I ask AI to write an entire paper that I am supposed to write, then the AI has completed the central academic task for me.

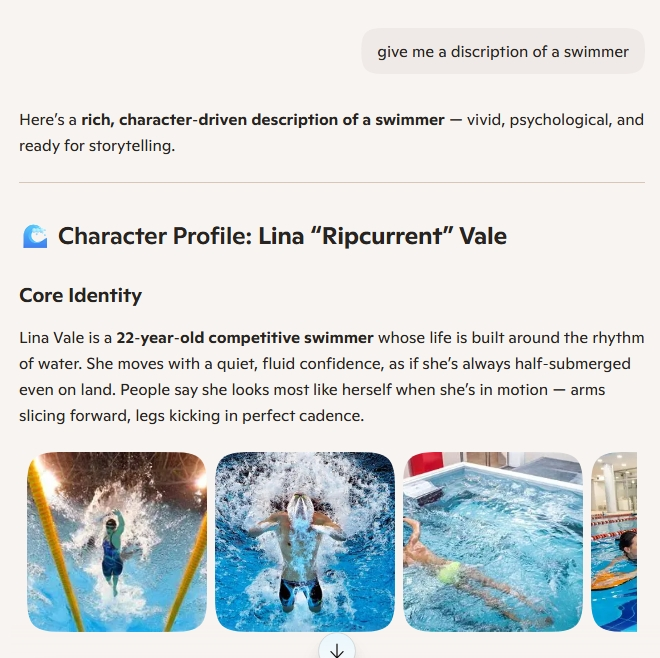
Another example we used was asking different AI sites, such as ChatGPT and Copilot, the same question. Interestingly enough, each site gave a different answer in its own way. The prompt my group asked was “Describe a runner and swimmer”. One site gave an AI drawing of a “runner”, while the other gave a daily life schedule of the athlete. This just shows you’ll never get the same response, so it’s important how reliable and credible your information is.

Artifacts

The photo that ChatGPT depicted a stereotypical white female runner. While one of my other classmates used Claud, it gave a actually cartoon running simulation where you can adjust the speeds. Other examples are the writing flow is different between the AI-generated answers and the human ones. The AI answers were more formal and used grammar that a student under a time limit wouldn’t use.

These artifacts are important because they show that the problem with AI in college is not simply that AI produces bad answers. The problem is that a good-looking answer can hide the fact that the student did not perform the thinking or practice that the assignment was intended to require. The images that these sites produced also show that every question won’t give the exact answer.

Reflections

The biggest thing I learned from this project is that the convenience of generative AI can actually make it harder to recognize what students are learning. If a student uses AI to complete an assignment, the finished product may look successful even though the student may not have developed the underlying skill.

When a task is difficult or time-consuming, there is an obvious temptation to let AI do more of it. AI is designed to make difficult tasks feel easier, and that can be useful. But in school, difficulty is not always a problem that needs to be eliminated. Sometimes difficulty is the point.

Conclusion

College is a place where our academic freedom can be shown through our authentic work. Generative AI can make academic tasks faster and easier, but faster and easier are not always the goals of education.

The MIT report itself recognizes both sides of the issue. It says AI has the potential to help students “be more productive, learn more efficiently, and build skills,” while also warning about the risks AI creates for learning, teaching, and the social environment of education.

For me, I learn better in situations where I make mistakes and eventually figure things out for myself. Therefore, I believe college students should not use generative AI to complete academic tasks that are meant to measure or develop their own knowledge and skills.

Work Cited

Nataliya Kosmyna et al, MIT Media Lab (2025). Your Brain on ChatGPT: Cognitive Debt when Using an AI Assistant for Essay Writing Task

Image 1: AI Generated from ChatGPT

Image 2: Screenshot from chat with Copilot

What is AI plan? Post 3: LLMs (week 4)

Before this week of class, I had no idea what the exact purpose of an LLM (Large Language Model) was. I also didn’t know it was the main backbone for generating answers in key AI apps, like ChatGPT and Copilot. The most interesting fact I found out was how it actually operates. The input text is split into smaller units called tokens, which can be words, subwords, or characters. Then those tokens are turned into an answer that represents semantic meaning. Also, the video where it visually showed the breakdown of the process was very interesting and something I would’ve never guessed went down.

One perspective that has changed about AI is the use of environmental resources required to operate it. My main issue is the energy and carbon emissions. As we know, training and running AI models require large -scale computing, increasing greenhouse gas emissions. This is a fact that has been talked about in almost all of my classes, which means it is a pressing matter for everyone constantly using AI and those who are being affected by this.

Going off of that statement, one practical application that I plan to use in my academic work is to encourage responsible AI usage. I will limit unnecessary high-energy tasks, such as large-scale image or video generation, and promote energy-aware AI design.

3Blue1Brown (2024, April 1). Transformers, the tech behind LLMs. Dftba Records. Transformers, the tech behind LLMs | Deep Learning Chapter 5

Data Set: Most Popular Dog Breed by Zip Code in Staten Island

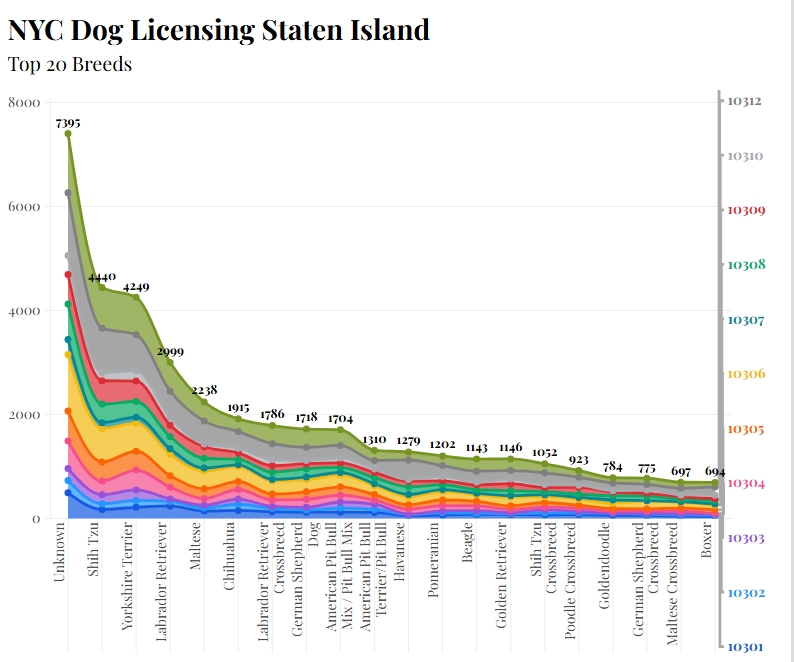
In this data set, we can see the most popular dog breed in the Staten Island Area. Flourish, the data tool I used to create this graph, was very straightforward. When I uploaded my spreadsheet with all the required information, it let me see the data laid out, but not in the most organized way. There are so many options to customize your work to your learning style or your audience’s learning style. At first, it was hard to read the information constructively because it was bunched up in one area, but after making customizations, I made it fit my particular style.

Process

  My first step was to download the data given so I could upload it to the Flourish website. Then I had to decide what graph would represent the best information. I chose an area chart because it spread how my information in a way was visually appealing and easier to interpret. I first went for the bar chart, but it distributed the data in a way that was hard to read and uneasy to the eye, which is the opposite effect I wanted.   The next step was to pick an enticing title so that my audience would want to learn more about the topic. Lastly, spent time looking through the different options Flourish provided and experimented with the way the data could be displayed. 

Artifact

  My artifact is a Flourish visualization showing dog breed data from the Staten Island area. My goal was to make the information from the original spreadsheet easier to compare and understand. The data includes many popular breeds, such as Shih Tzu, Yorkshire Terrier, Labrador Retriever, and Chihuahua, along with an “Unknown” category. Seeing the information visually made it easier to notice differences between the breeds than it was when I was looking at the original spreadsheet. I think I achieved my goal because I was able to take information that originally felt crowded and confusing and customize it into a visualization that is easier for me to understand and share with others. 

Reflection

  This project taught me that data visualization is not just about entering information into Flourish and letting the tool create the final product. I still have to make decisions about how the information should look and what will make the most sense to my audience. I learned that having many customization options can be helpful because different people may understand information in different ways. At the same time, too many options can make the process overwhelming at first. I also learned that I need to think about accessibility and how someone seeing the graph for the first time might interpret it. Next time, I would experiment with more designs before deciding on my final visualization. 

Credits

Data provided as part of the course project. Visualization created using Flourish. Any screenshot included is my own work.

Declaration of AI Use: I used AI to help proofread and organize my writing. The ideas and experiences in this report are my own, and I reviewed the final version to make sure it still sounds like me and reflects my experience using Flourish.

Week 2 Reflection Blog Post: Data

In my small group, we discussed several topics related to the archived Wooster Voice newspaper posts. We questioned the reasoning behind these posts and how we could determine their main agenda. We also considered which issues were most relevant over 60 years ago, since concerns in the 1960s may have differed from those we face today. Finally, I wondered whether the newspaper focused more on men’s sports than women’s.

They were pretty interesting questions for our group because we didn’t know anything about life on Wooster’s campus back then, so it’s always interesting seeing what we can find!

The Wooster Voice. (2022). http://introdh.voices.wooster.edu/wp-content/uploads/sites/540/2026/08/cropped-Screen-Shot-2020-03-26-at-3.34.48-PM.png

I would organize the spreadsheet to focus on how women’s sports were represented in the Wooster Voice. Each row would represent one article or newspaper post about a women’s sports team or athlete. The columns could include the date, sport or team, article title, type of coverage, athletes mentioned, amount of coverage, tone of the article, main topic, and how women athletes were portrayed.

For controlled vocabulary, I would use consistent terms such as women’s basketball, women’s soccer, athletics, gender, achievement, competition, leadership, and academics. This would make it easier to compare articles and see how the representation of women’s sports changed over time.

I would approach data privacy by only including information that is already publicly available in the Wooster Voice archives. I would avoid collecting unnecessary personal information, such as addresses and phone numbers. Since the project focuses on multiple women’s sports and not individuals, I would limit names to athletes or coaches who are directly mentioned in the articles.