
Ethical concerns in FD?

(Thought I posted this at 9:47am, just saved the draft better late than never)

As with anything that involves using information, Artificial Intelligence , and releasing that online for the world to see there are ethical concerns that arise when thinking about how you’ll execute a project. My project focuses on International Film Distribution. Still in its early stages I plan to use or create a dataset of perhaps 30 or so films from both inside and outside the U.S. that debuted in Theaters . Using variables such as Title, Year, Country of Production, Distributor, Domestic release date, International release date, Genre, Director, Language, Box Office. This not only to create an understanding of Film distribution but also to create a sense of how these markets work with each other and how censorship, politics and other factors influence what gets released and where. So part Data Visualization part Digital Storytelling.

Data Collection: This one is interesting. Much of the data I would collect would be public, However if I only use easily accessible databases, my dataset could unintentionally favor films from certain countries, industries, or time periods. I probably need to clearly say where my data comes from, how films were selected, and what limitations or gaps exist in the dataset.

Privacy: Privacy would probably be a relatively minor concern because the project would primarily examine films, distribution companies, countries, and publicly available information. Avoiding personal details about directors and those involved in the filmmaking and distribution process should relatively simple.

Transparency and Providing Context: Visualizations can make data appear more objective or complete than it actually is. I will clarify what criteria I used to include films and what may be skewed in the visualization. For example, a map showing that one country distributes more films internationally than another does not necessarily mean that its cinema is more culturally influential and so on.

AI Use: Environmental Concerns: If, and that’s a big IF, I use AI tools during the project like to brainstorm, organize information, analyze text, or assist with coding and such there is a potential environmental concern because AI systems require computing resources and energy. Noman Bashir of MIT brings a great point when saying “What is different about generative AI is the power density it requires. Fundamentally, it is just computing, but a generative AI training cluster might consume seven or eight times more energy than a typical computing workload,” Using an LLM model to even help brainstorm a dataset outline would use ridiculous amounts of energy. In the end it would be better to just avoid AI use as much as possible.

Accessibility / Universal Design: Accessibility should be considered when creating the project’s designs. A visualization that depends entirely on color, for example, may be difficult for some users to interpret, while an interactive map may be difficult to navigate with a keyboard or screen reader. I should provide readable labels, good contrast, descriptive captions.

Generative AI usage: No Gen was used in the writing of this module

Sources: https://news.mit.edu/2025/explained-generative-ai-environmental-impact-0117?utm_source=chatgpt.com

https://www.iubenda.com/en/help/181591-inclusive-design/
What to do? What to do? – Final Project Proposals

The Brainstorming session on Wednesday 23rd, 2026 has left me with two possible topics for the Final Project. All which equally pull my interest. However some might be easier than others. The first topic is inspired by our discussion on the use of LLMs in academics. This time it would be looking at the use of LLMs in the scientific or political fields. This idea stemmed from the recent reports that U.S. military nearly launched an attack on a Chinese Vessel when an AI chatbot an analyst had used inaccurately identified the material the ship was carrying as nuclear weapons. Despite this being the first topic I came up with, this is the less developed of the two in terms of how I would execute it as a Digital Humanities project. However I did think of a few questions I could ask: What are the potential risk of LLM mistakes when used militarily? Do AI-generated campaign messages become more standardized than human-written ones?

The second idea is the one that ended up exploring during class, that being International Film Distribution. The will be a combination of data analysis with a sprinkle of digital storytelling. The questions I had were as follows: What does the network of international film distribution look like, and how has that network changed over time? Does international film distribution create a genuinely global network, or does it concentrate around a relatively small number of cultural and economic hubs? How did films move between countries, and what geographic patterns or inequalities emerge from those distribution networks?

The next part was figuring what skills I wanted to improve and how that would influence they way I would end up executing this project. Not entirely satisfied with the visualization of the Dog Breeds data, that would be a skill I would like to improve. It terms of tools I had no clue. I did participate in the LLM prompting in class, and I’m not gonna lie it didn’t help as much as maybe I had hoped. However most likely I will either build or find a data set that fits within my questions and then maybe then visualize the data as a network while also taking into account how disproportionate some of the data might depending on how much data we have on film distribution in certain areas. (It’s a little late uploading, Voices really didn’t want me to upload an image for some reason)

AI use: No artificial intelligence was used in the writing or editing of this blog post.

The LLM Dilemma

The Dilemma: With the rise of publicly available Large Language Models the question of it’s use in academics has been one educators and students have pondering The past two weeks of class have made it quite clear that the use of LLMs in academia to “help” with cognitive tasks is a slippery slope. All of that said, I believe that students should not use ANY generative AI models to complete academic task.

The Reasoning/Process: There are two sources we looked at in class which, to me, represent the biggest issues for students or really anyone relying on LLMs to help with cognitive task or with generating images and data. Firstly, the MIT report, which looked at the cognitive effects of using LLMs when writing an essay compared to those who simply used their brain to write it. While in truth their study wasn’t perfect, it doesn’t address AI use in the medical or scientific field, the results for the academic field are hard to argue against. Within this study MIT took 54 participants and split them up into three groups. The LLM group, Search Engine group and Brain-only group. By the end of the study it was shown that more external help the participants had in writing the essay the less their brain connectivity was. “Brain connectivity systematically scaled down with the amount of external support: the Brain‑only group exhibited the strongest, widest‑ranging networks, Search Engine group showed intermediate engagement, and LLM assistance elicited the weakest overall coupling.” The Brain-only and Brain-to-LLM participants showed a greater sense or ownership, memory recall, and overall better scoring.

When we did our own little study in class, while factors like the size of class or the time we had to produce our arguments definitely impacted the results, they still overall showed the exact same thing. Those who wrote their arguments using their own brain had a better time recollecting what they had written in comparison to those who relied on a LLM to write out their entire argument for them.

Another aspect of this is the use of AI image generation and the bias it can present. AI image generation can be used on things like presentations for example, However AI’s bias producing issues are a major hit against it when using it in such a way. Since, generative AI models produce sentences and images by predicting the statistical likelihood of what comes next or what should be generated based on token patterns they may generalize already biased data, then present and even more biased version of it. What’s worse is then the models train itself on that output thus making the bias even worse.

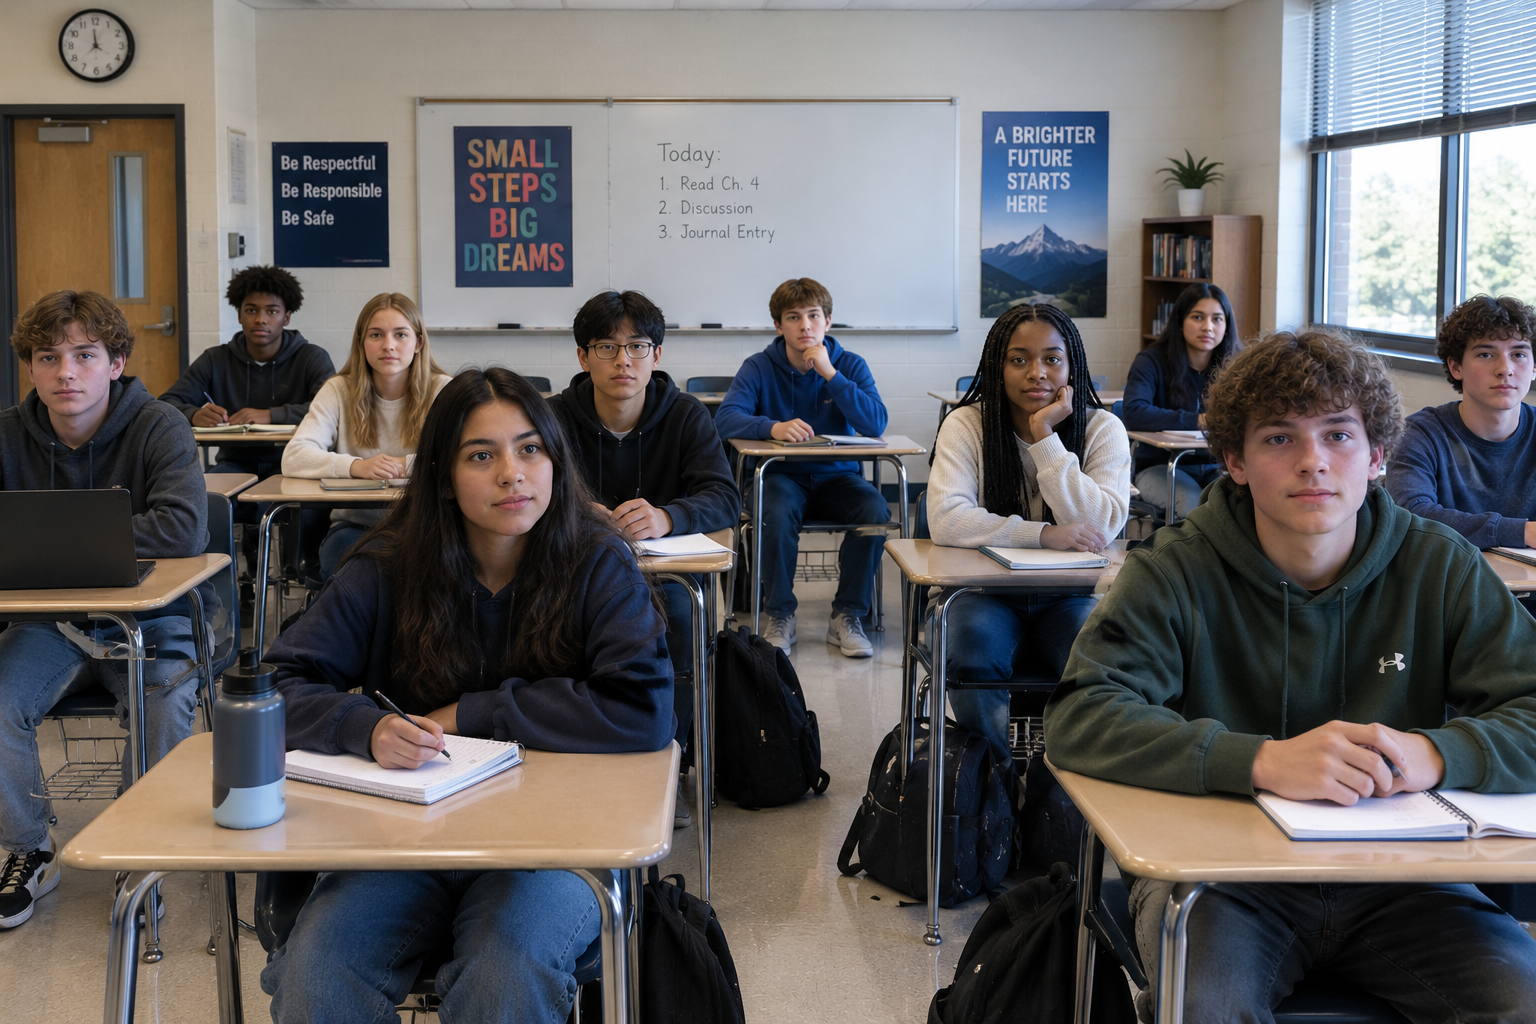
Artifacts – This can be demonstrated in the generated Image below. One of the main things I tested was diversity when it came to image generation. Thus I asked ChatGPT to create an image of the Average American classroom. To not possibly skew the results I left the subject out of the prompt. Here you can see a classroom of students. To untrained eye this looks like a pretty good representation of what the American classroom looks like nowadays, right? Well, not exactly. Firstly, while there is diversity here, it’s basic. The biggest issue is not only the vagueness of ethnic background ( is anyone here from Europe, South America, Mexico, Africa?) but also gender is pretty much as basic as it gets. There is no clear signs of anyone who may not identify as male or female or who may have perhaps transitioned. Now, granted asking the generative AI to put that there may make the system draw way too much attention to it rather than just inserting it casually and naturally. Lastly everyone is wearing the same hoodie and the same pear of jeans.

A portion of the main home page of the MIT report summarizes my thoughts of LLM use in academia. “As the educational impact of LLM use only begins to settle with the general population, in this preliminary study we demonstrate the pressing matter to explore further any potential changes in learning skills based on the results of our study. The use of LLM had a measurable impact on our participants, and while the benefits were initially apparent, as we demonstrated over the course of 4 sessions, which took place over 4 months, the LLM group’s participants performed worse than their counterparts in the Brain-only group at all levels: neural, linguistic, scoring.”

Cheung, J. (2023, August 21). How AI image generators make bias worse. London Interdisciplinary School. https://www.lis.ac.uk/stories/how-ai-image-generators-make-bias-worse

Kosmyna, Nataliya. “Your Brain on Chatgpt: Accumulation of Cognitive Debt When Using an AI Assistant for Essay Writing Task.” Your Brain on ChatGPT: Accumulation of Cognitive Debt when Using an AI Assistant for Essay Writing Task, June 2025. https://www.brainonllm.com/.

The Wonderful Statistical World of LLMs

The most interesting thing I learned about LLMs was how GenAI can not only produce bias information but also that overall A.I. bias can be more extreme than real-world bias. This was covered in Jon Cheung’s article for The London Interdisciplinary school. I think most people don’t really think about what a generative A.I. model is really doing when it’s asked to make an image. What makes it worse it the fact that the biased images the generative A.I. produces that are uploaded to the internet will then by fed back to it. For example, if you ask an image generator for a series of pictures of CEOs there is high chance that it will mostly produce a mid 40s white make in suit standing and smiling in a boardroom. If you upload that to the internet that those images can then be used to train the same or another A.I. image generator.

Another interesting thing was learning how exactly the token system worked. I didn’t know that A token is not always a full word. It definitely can be a whole word but it can also be a fragment of a word, a phrase, or individual letters. Then the text generation happens using the probability distribution across every token in its vocabulary for what should come next. Real good semi-complicated stuff.

In terms of my uses for A.I. I only plan to use it for organizing/ summarizing given information. I don’t use it for anything outside of that.

Citations/Sources

Cheung, J. (2023, August 21). How AI image generators make bias worse. London Interdisciplinary School. https://www.lis.ac.uk/stories/how-ai-image-generators-make-bias-worse

3Blue1Brown. (2024). Transformers, the tech behind LLMs | Deep Learning Chapter 5, YouTube. https://www.youtube.com/watch?v=wjZofJX0v4M

Declaration of AI Use: No generative A.I. was used in the writing of the blog post, nor for grammar.

Most Popular Dog Breed By Zip Code in Staten Island, NY

This graph aims to show the most popular breed by Zip Code for Dogs in Staten Island New York. Now, when I first put this data into Flourish, most of the chart options that were presented were not ideal. There was too much visually going on, sometimes the charts just left things out, and it really struggled with what the zip codes actually represented in the data. Eventually I decided on a Bar Chart that allowed for someone to switch between the zip codes( Top Left) and see the information. Not only did it, mostly, fix the issue of too much information at once it allowed for all the numbers and names to be scene clearly which was big issue with the other charts and graphs generated. Unfortunately the public the version on Flourish is too wide for voices and some of the names overlapped. This was mostly rectified by placing the alignment of the chart to the side. Overall Flourish does have a learning curve but once you get past that you should be able to figure most things out, eventually.

The question that came to mind when first scanning through the excel sheet was: Are more breeds preferable in certain regions than others? I was looking to see if some regions had certain preferences and if I could perhaps find a pattern. For example, in most places the Shih Tzu is in the top five, more often the top three or two. Now, there a few quirks finding the answer to this. Seemingly most people have no clue what type of dog they own and since unknown is category it sits at the top for almost every region. Another aspect of the question difficult to answer is the “why” of it all. I have no information on how big the regions are or the financial status of them. However, the basic essence of my question is clearly answered by the chart. Rather then keep the names in the same order on the spreadsheet (though if you are curious the order at the top is the same order as the spreadsheet) I made it so the names would be sorted by value. The highest at the top and the lowest at the bottom. In retrospect taking away some of the zip codes at the end that have like no data would probably help clean things up.

Ethical questions are actually not too much of an concern. Yes, there are zip codes listed here but other than that there is no specific identifying information here for anyone . It’s seemingly anonymous. No private information, names, full addresses. The only thing is perhaps if the data collected is technically public information and where di they receive it? From Staten Island? Pet stores? No generative AI was used in the making of this chart.

Data to a spreadsheet